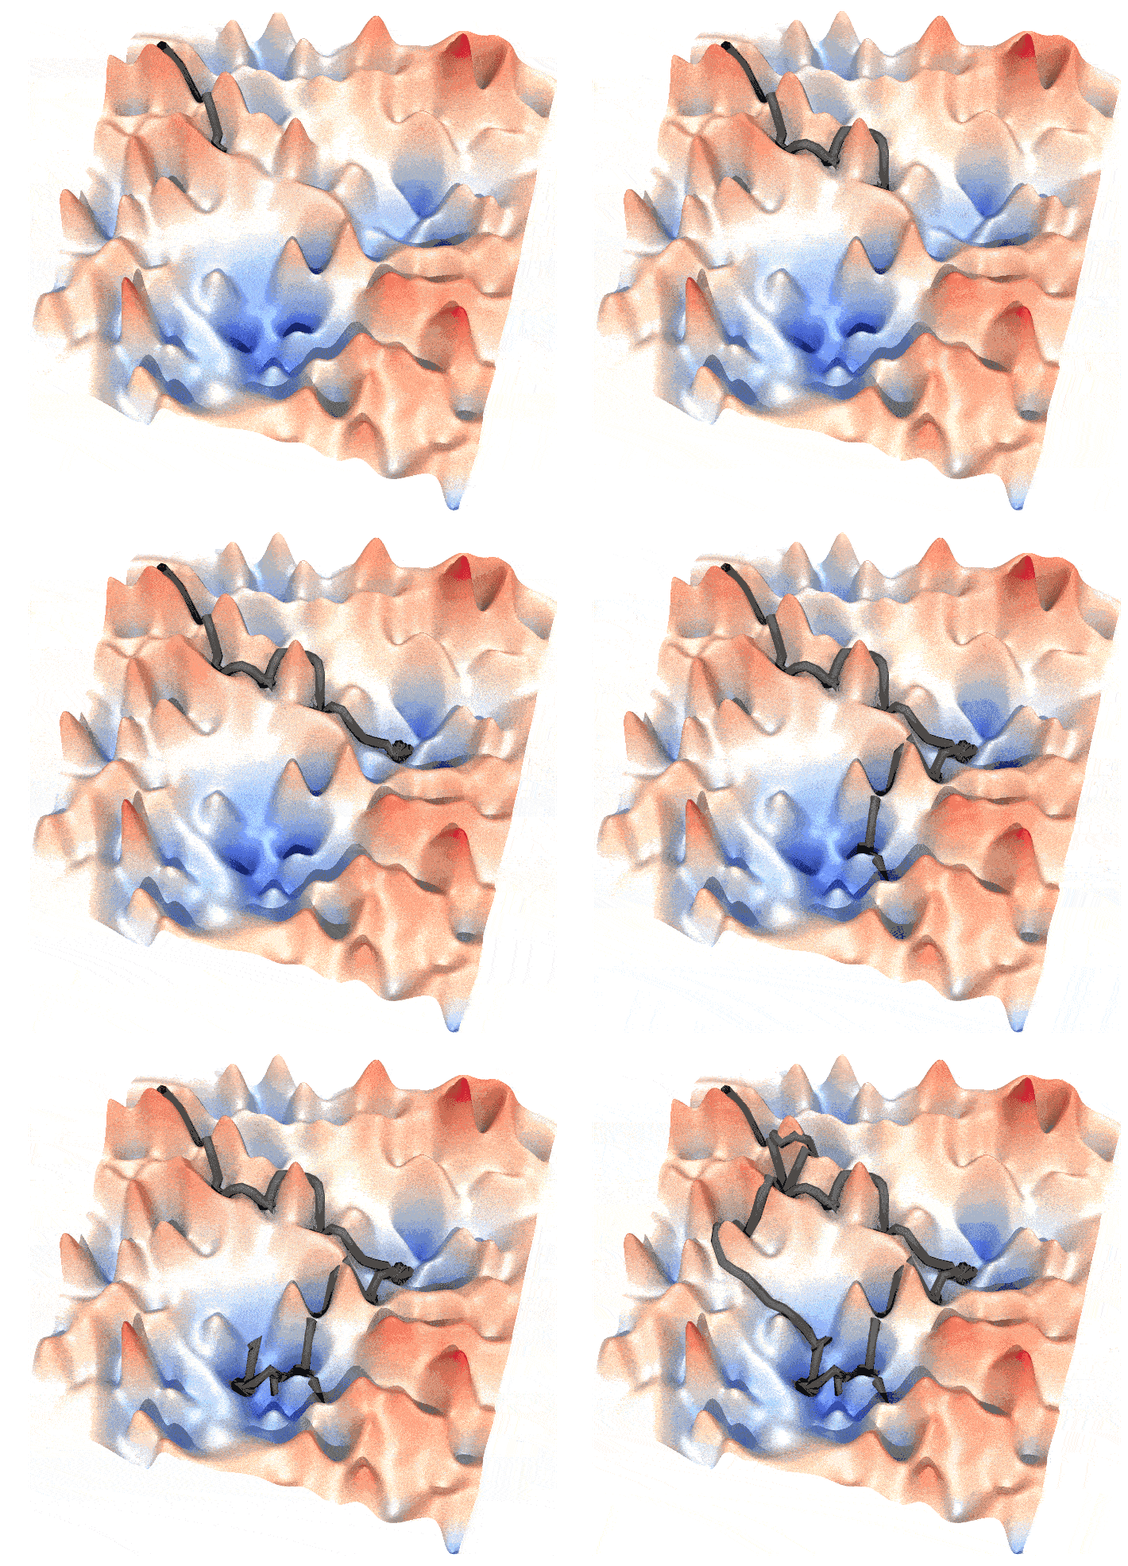
A path on energy landscape is like:

and this post is a guide to generate such animations.
Step 1: Generate the Energy Landscape
An energy landscape is essentially an energy function $U(\mathbf{x})$. This function can be created in various ways. For example, you might generate a series of Gaussian functions with random parameters $\mu_i$, $\sigma_i$, and weight factors $\omega_i$. From these, you can construct a probability function $P(\mathbf{x}) = \sum_{i=1}^N \omega_i G(\mathbf{x}; \mu_i, \sigma_i)$. The energy function $U(\mathbf{x})$ is then derived using Boltzmann inversion: $U = -k_B T \log P$ .
In the example above, I generated a series of Mexican hat functions with varying parameters ($a$), ($b$), and locations.
Step 2: Generate the Path
A path is determined by the dynamics of the system, such as $\dot{\mathbf{x}} = -\nabla U(\mathbf{x})$ or $\ddot{\mathbf{x}} – \dot{\mathbf{x}} = -\nabla U(\mathbf{x})$. By integrating from a starting point, you can generate a path. In our example, the walker follows a cyclic path, which requires an understanding of the Lagrangian.
A walker on an energy surface from point $A$ to $B$ takes the “canonical path” where the Lagrangian is minimized. The probability of the walker being at $A$ at time $t_0$ and reaching $B$ at time $t_1$ is given by:
$$
P(\mathbf{x}_A, t_0 \mid \mathbf{x}_B, t_1) = \frac{1}{Z} \int_{\mathbf{x}(t_0) = \mathbf{x}_A}^{\mathbf{x}(t_1) = \mathbf{x}_B} \mathcal{D}\mathbf{x} \exp\left(-\int_{t_0}^{t_1} L(\mathbf{x}, \dot{\mathbf{x}}, t) \, dt\right)
$$
Maximizing this probability implies minimizing the Lagrangian $L$ (saddle point approximation). Given $L = T – U$ with $T \propto \dot{\mathbf{x}}^2$, we can discretize the integral of $L$ as:
$$
L = \sum_{i=0}^N \lambda_1 (\mathbf{x}_{i+1} – \mathbf{x}_i)^2 – U(\mathbf{x}_i)
$$
where $\mathbf{x}_0 = \mathbf{x}_A$ and $\mathbf{x}_N = \mathbf{x}_B$. Here, $\lambda_1$ is a hyperparameter controlling the path’s tightness. Our goal is to find a series of $\mathbf{x}_i$ that minimizes $L$. This can be achieved using scipy.optimize.minimize
Step 3. Generate the animiation
The output can be drawn by mayavi, in the example I draw the frames of the animation by povray, where .pov files were generated by mayavi. The trajectory is a thick line that slightly shifted higher than the energy landscape surface to ensure a clear view. You can also draw a big point (sphere) at the forefront of a trajectory, to emphasize the walker.
